Research
October 27, 2025
Training loss predicts evaluation performance, even for non-verifiable tasks
Loss: the cheapest evaluation you’ll ever run.
Authors
Affiliations
Charles O'Neill
Parsed
Max Kirkby
Parsed
TLDR: Training loss reliably predicts LLM-as-judge evaluation scores, even for non-verifiable tasks. This means you can optimise model performance without running expensive evaluation suites all the time, and instead just track the loss.
At Parsed, we help companies replace their expensive closed-source language models with optimised open-source alternatives that are not only cheaper and faster, but actually better at their specific tasks. The key challenge is deciding exactly where to operate on the cost-performance frontier. You can always trade compute (bigger models, higher latency) for better performance, but finding the sweet spot requires knowing how each configuration will perform before you commit resources.
What’s interesting is that while the ML community has extensively studied how loss correlates with performance on verifiable benchmarks (math problems, coding tasks, multiple choice questions), nobody has rigorously examined whether this holds for non-verifiable, domain-specific tasks evaluated by LLM judges. This matters enormously for real-world applications; most enterprise tasks don't have ground truth answers, just expert judgment about quality. If we can predict evaluation scores from training loss alone, we can dramatically accelerate the optimisation process, using loss as a reliable signal to guide fine-tuning before transitioning to more expensive human feedback signals.
This post demonstrates exactly that relationship using a clinical scribe task as our testbed. We trained 15 model configurations spanning the Qwen-3 family (1.5B to 32B parameters) on three dataset sizes (1,293 to 4,673 examples), using LoRA fine-tuning with consistent hyperparameters (rank 64, alpha=32, lr=2e-4, constant learning rate). For evaluation, we developed an ensemble of 5 LLM-as-judge prompts specifically optimised for medical scribing (even more importantly, for this particular clinical scribe), measuring adherence to clinical templates, appropriate medical inference, correct terminology, information completeness, and absence of hallucinations. Each judge provides a binary pass/fail decision with rationale, and we average these to compute an overall pass rate. Importantly, we optimised these prompts to align with the scribe company's medical knowledge team while minimising variance (ensuring consistent scores for the same input across runs).
While this is admittedly a toy-scale exploration, the patterns we uncover here hold remarkably well; we've validated these same relationships at production scale with up to a million training examples and 235B parameter models across multiple customer tasks. The results reveal that training loss alone explains 74% of the variance in evaluation performance, with near-perfect prediction (R^2 > 0.90) when controlling for dataset size. This finding is robust across model scales, data regimes, and even different judge models.
Training loss strongly predicts evaluation performance
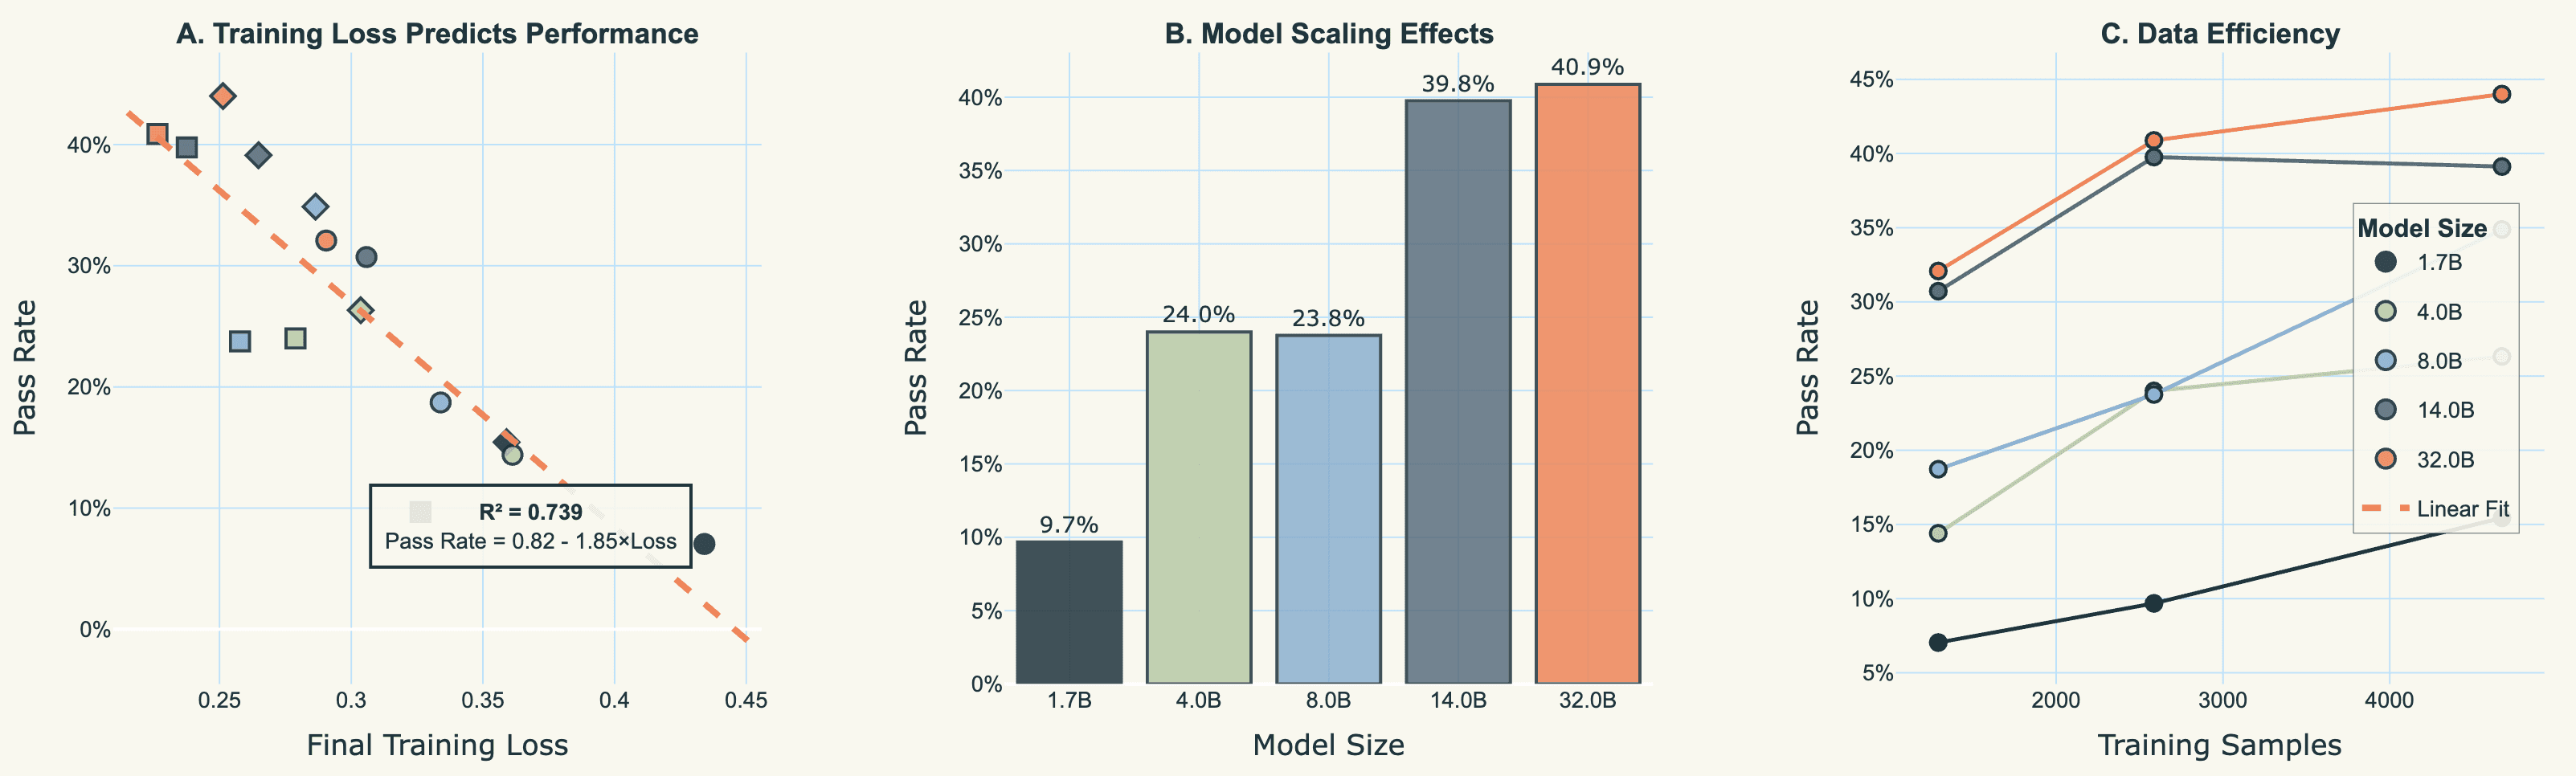
Our first key finding is remarkably simple: training loss is a highly reliable predictor of evaluation quality. Figure 1 shows this relationship across all 15 training configurations (5 model sizes × 3 data sizes). The correlation is striking—training loss alone explains 74% of the variance in evaluation pass rates (R^2 = 0.739, Pearson r = -0.86).
The relationship is cleanly linear: for every 0.1 decrease in final training loss, we observe an 18.5 percentage point increase in pass rate. This means you can predict evaluation performance from training metrics alone, without waiting for expensive evaluation runs to complete.
What makes this particularly valuable is its consistency. The prediction holds across:
A 20× range in model sizes (1.7B to 32B parameters)
A 3.6× range in training data (1,293 to 4,673 examples)
Different evaluators (both Gemini-2.5-Flash and GPT-5-mini show r ≈ -0.86, despite a 2.8× calibration difference in absolute pass rates)
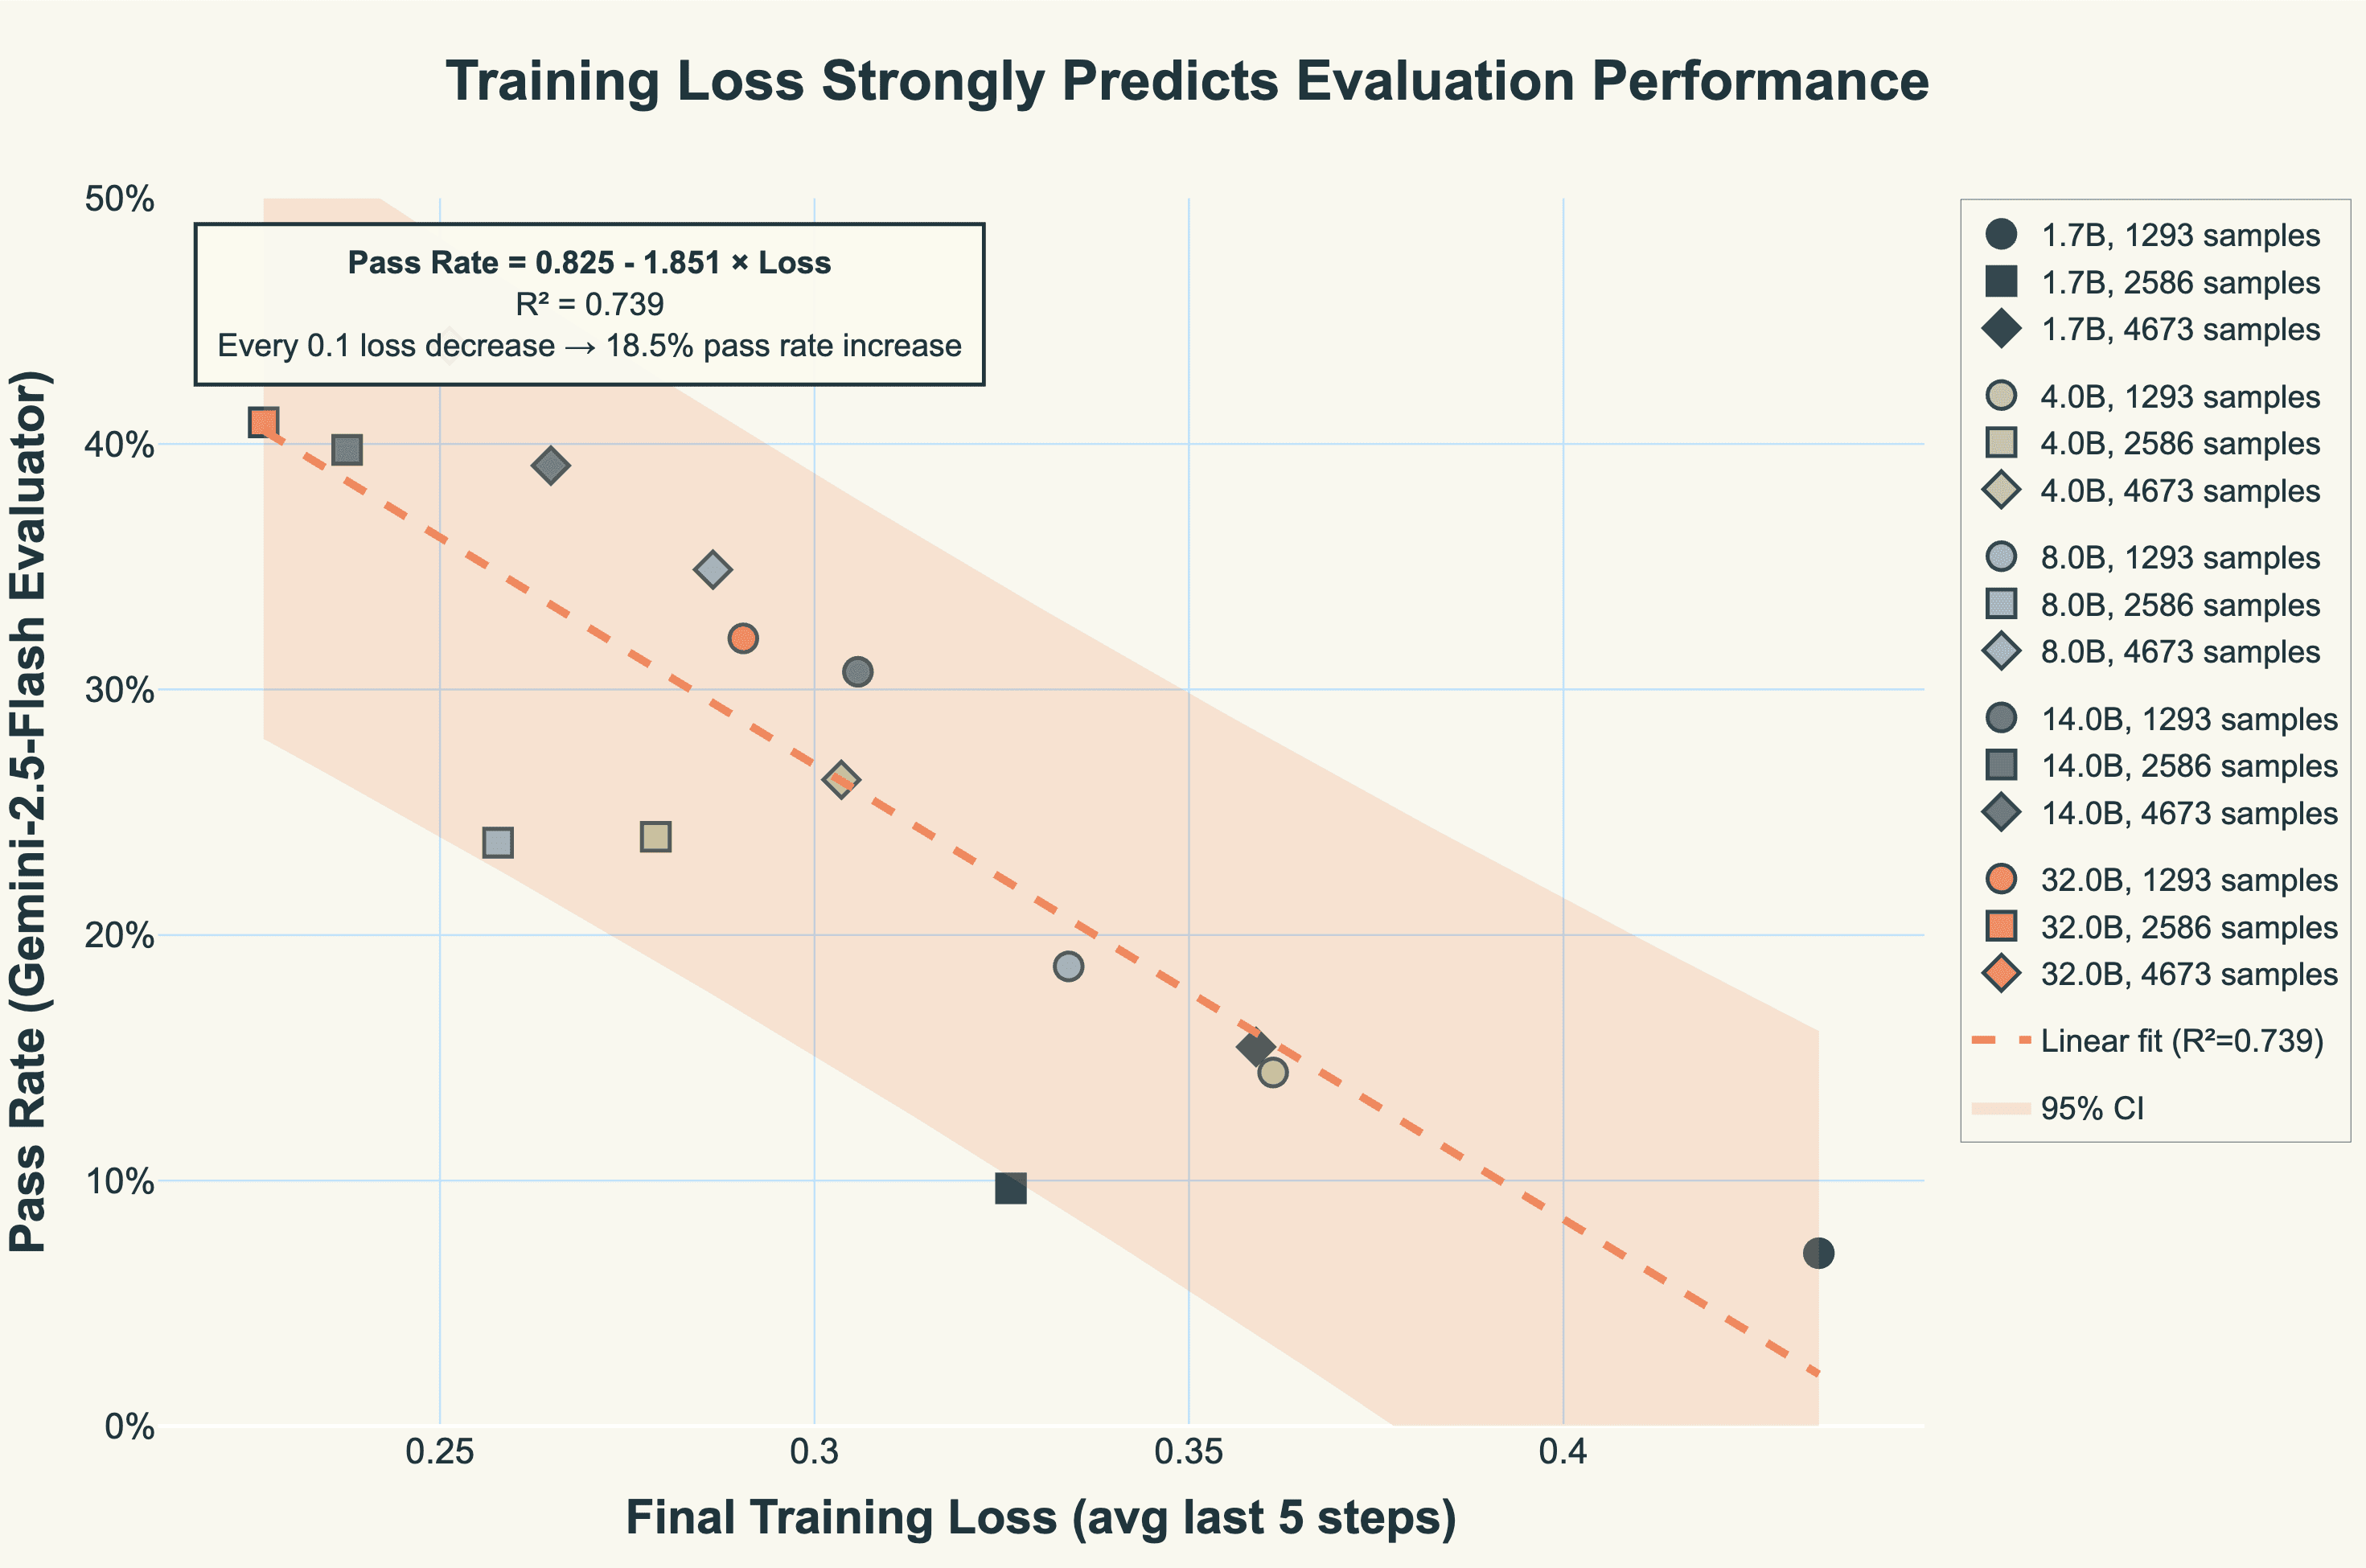
Figure 1: linear regression fit of evaluation score against final training loss against all 15 model configurations.
The linear fit improves significantly when we fix the data size and examine each regime separately. When we condition on training data size, the relationship becomes much tighter (Figure 2). Breaking the analysis into three panels (one for each data regime) shows R^2 values of 0.904, 0.930, and 0.978. This suggests that training loss predicts performance most reliably within a fixed data regime. Some scatter in the overall plot comes from the non-linear relationship between data size and performance.
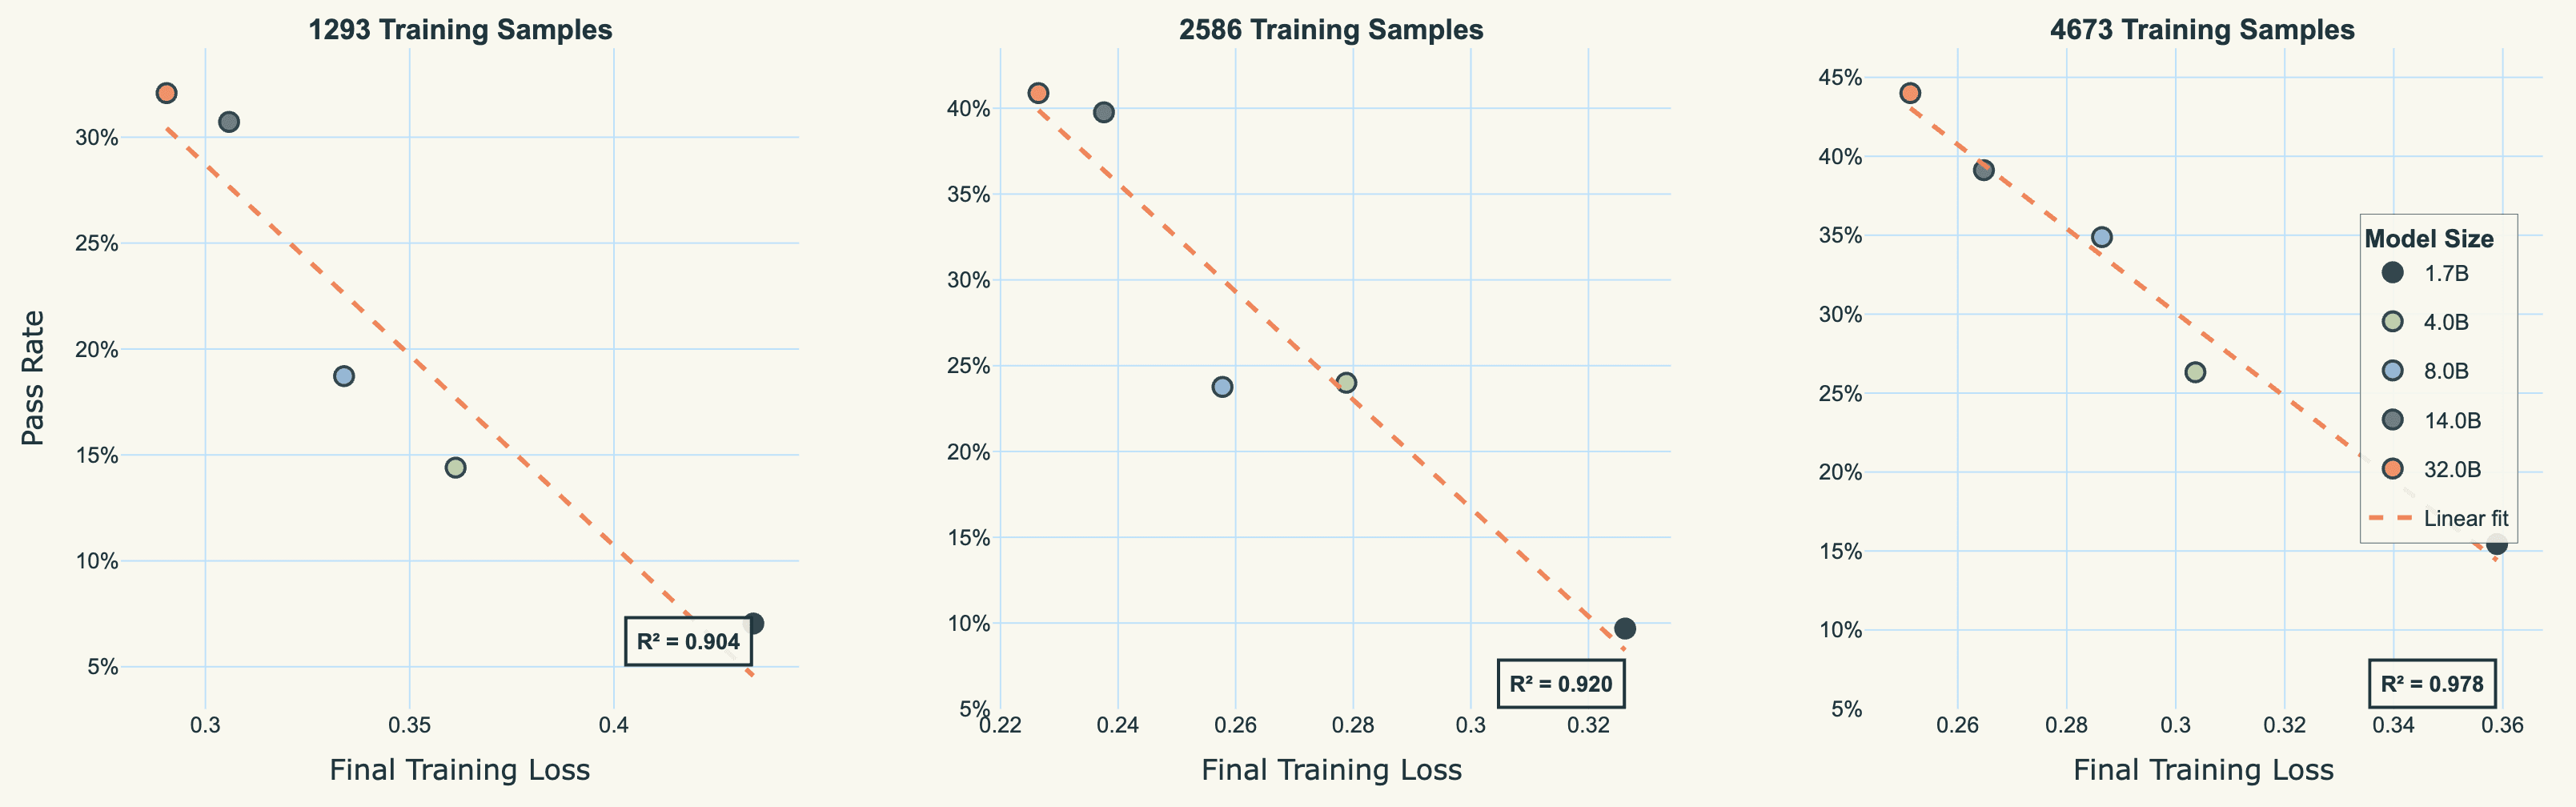
Figure 2: linear fits holding dataset size constant.
Each panel maintains the strong negative correlation, but with notably different slopes and intercepts. The 1,293-sample regime (left) shows steeper improvement with loss reduction but lower absolute performance. The 4,673-sample regime (right) shows the highest pass rates but also signs of optimisation challenges, with some configurations achieving higher loss than their medium-data counterparts.
This holds across different LLM-as-judges
A natural concern when using LLM-based evaluation is consistency: are different evaluators measuring the same thing? Figure 3 addresses this directly by comparing two independent judge models (Gemini-2.5-Flash and GPT-5-mini) across all 30 experimental configurations.
Despite a 2.8× difference in absolute pass rates (Gemini averages 26.7%, GPT-5-mini averages 9.5%), both evaluators show nearly identical correlations with training loss: r = -0.86 for Gemini, r = -0.87 for GPT-5-mini. Thus, these evaluators differ in their stringency threshold, but they're measuring the same underlying quality dimension.
This consistency has important implications. First, it validates that training loss captures real model capability, not evaluator-specific quirks. Second, it means you can use training loss to predict evaluation outcomes regardless of which judge you eventually deploy. The absolute pass rate will differ based on calibration, but the relative ranking of models remains stable.
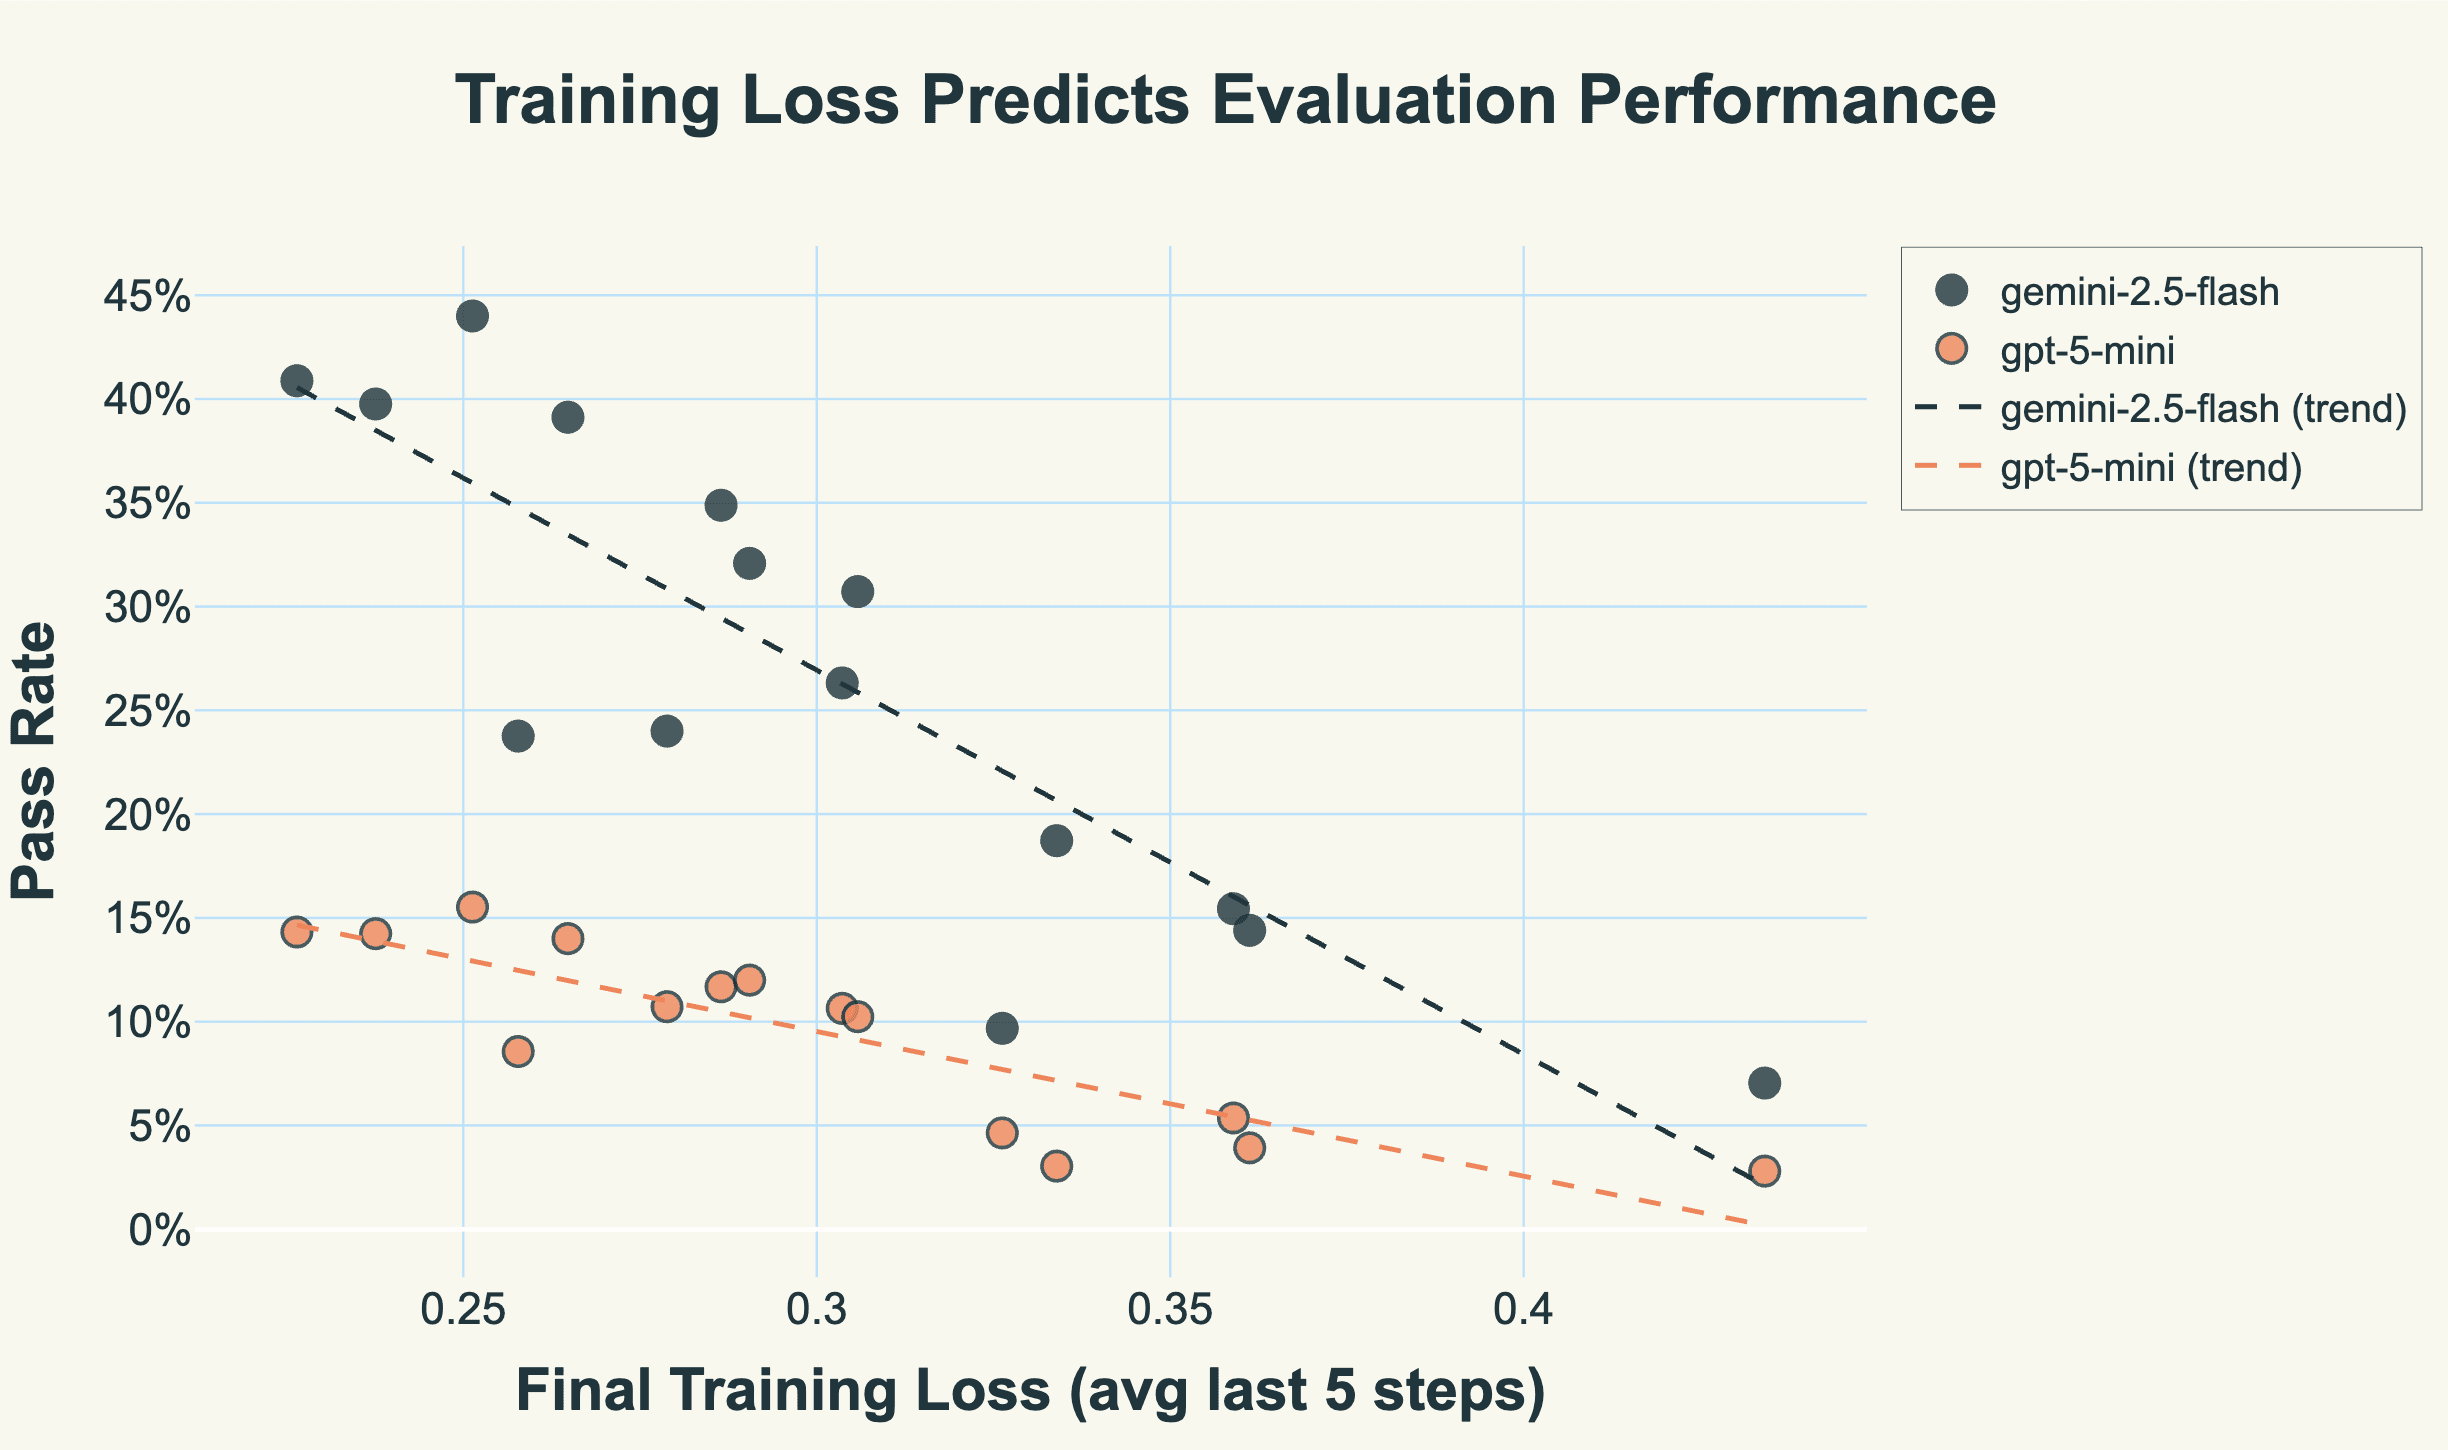
Figure 3: Training loss predicts evaluation performance consistently across different LLM judges. Despite Gemini-2.5-Flash being 2.8× more lenient than GPT-5-mini in absolute pass rates, both show nearly identical correlations with training loss (r ≈ -0.86).
Figure 4 decomposes performance across our two key scaling dimensions: model size and training data quantity. The chart reveals several patterns.
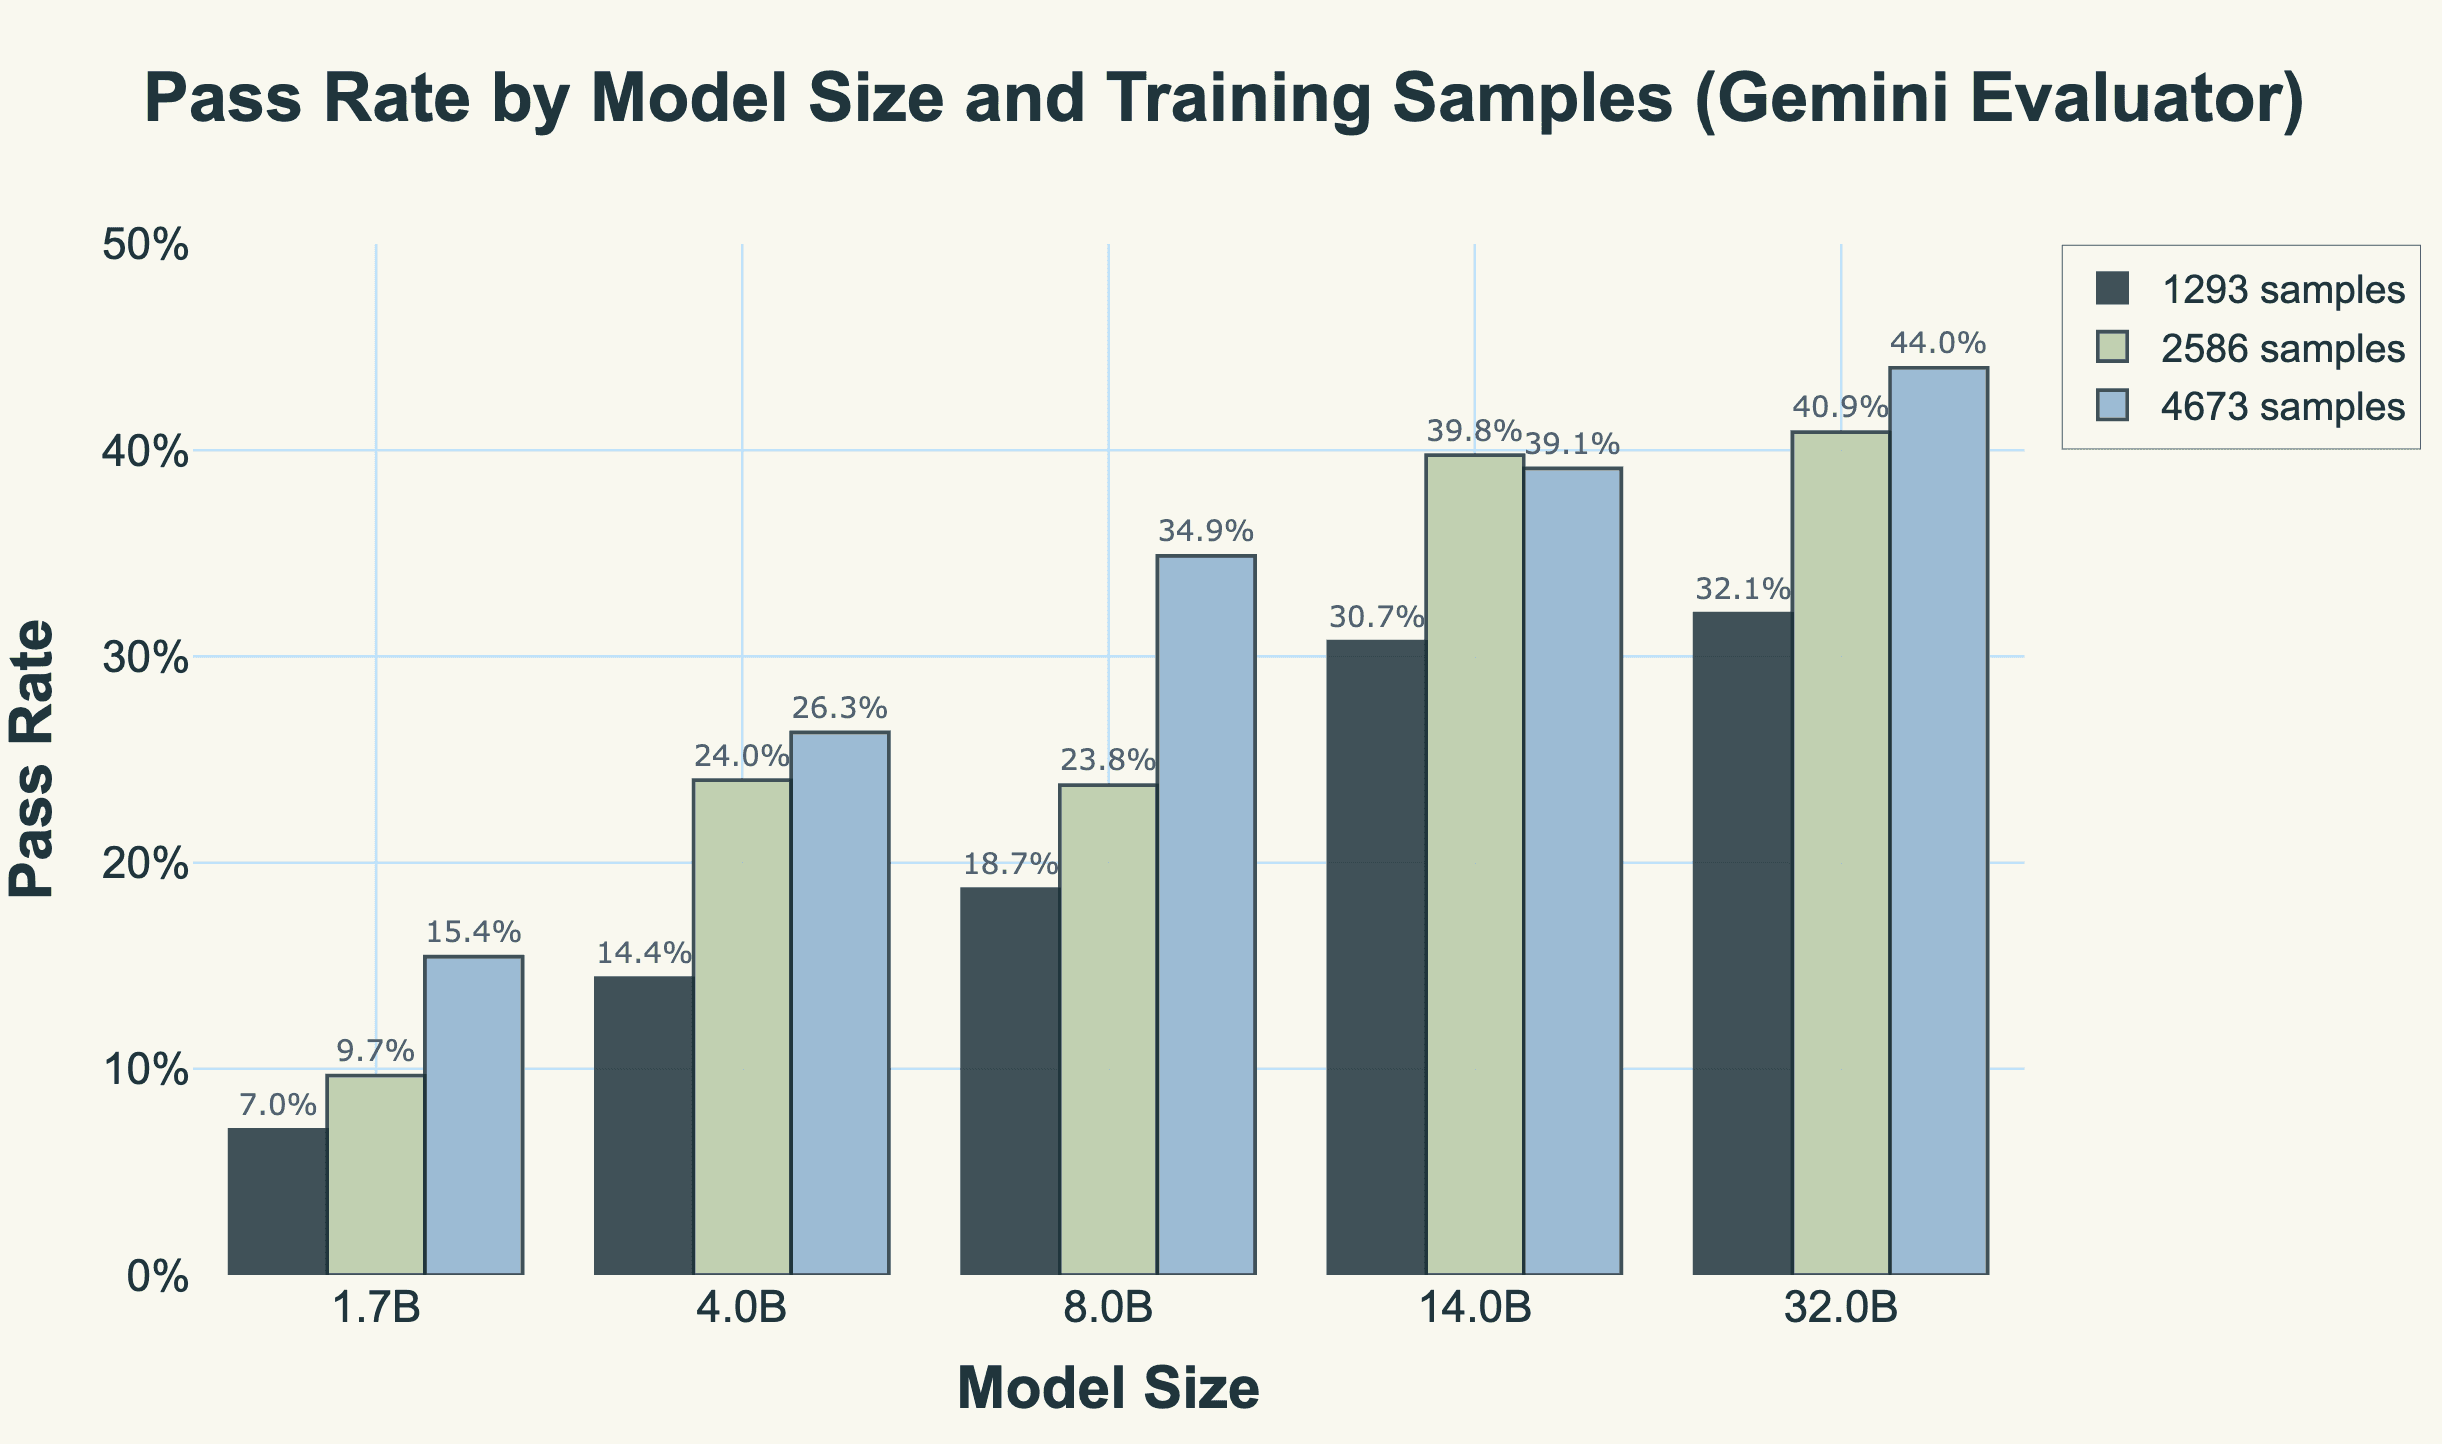
Figure 4: Pass rates by model size and training data quantity (Gemini-2.5-Flash evaluator). Larger models consistently outperform smaller ones, and data scaling shows monotonicity.
First, model size scaling is substantial but sublinear. Moving from 1.7B to 32B parameters (a 19× increase) yields a 6.3x improvement in pass rate (from 7.0% to 44.0% at their best configurations). The largest gains come early: doubling from 1.7B to 4B more than doubles performance, while the final jump from 14B to 32B adds only 4 percentage points despite a 2.3× parameter increase. This is the familiar pattern of diminishing returns from scaling laws.
Second, data scaling is generally beneficial and monotonic. Four out of five model sizes show consistent improvement as training data increases from 1,293 to 4,673 samples. The 8B model demonstrates this most dramatically, jumping from 18.7% to 34.9% pass rate as data increases. However, the 14B model breaks this pattern: it achieves 39.8% pass rate with 2,586 samples but drops to 39.1% with 4,673 samples, despite having nearly twice the training data. Its training loss also increases (0.238 → 0.265), confirming this isn't just evaluation noise the model is genuinely learning less effectively with more data, so probably just an unfortunate training run.
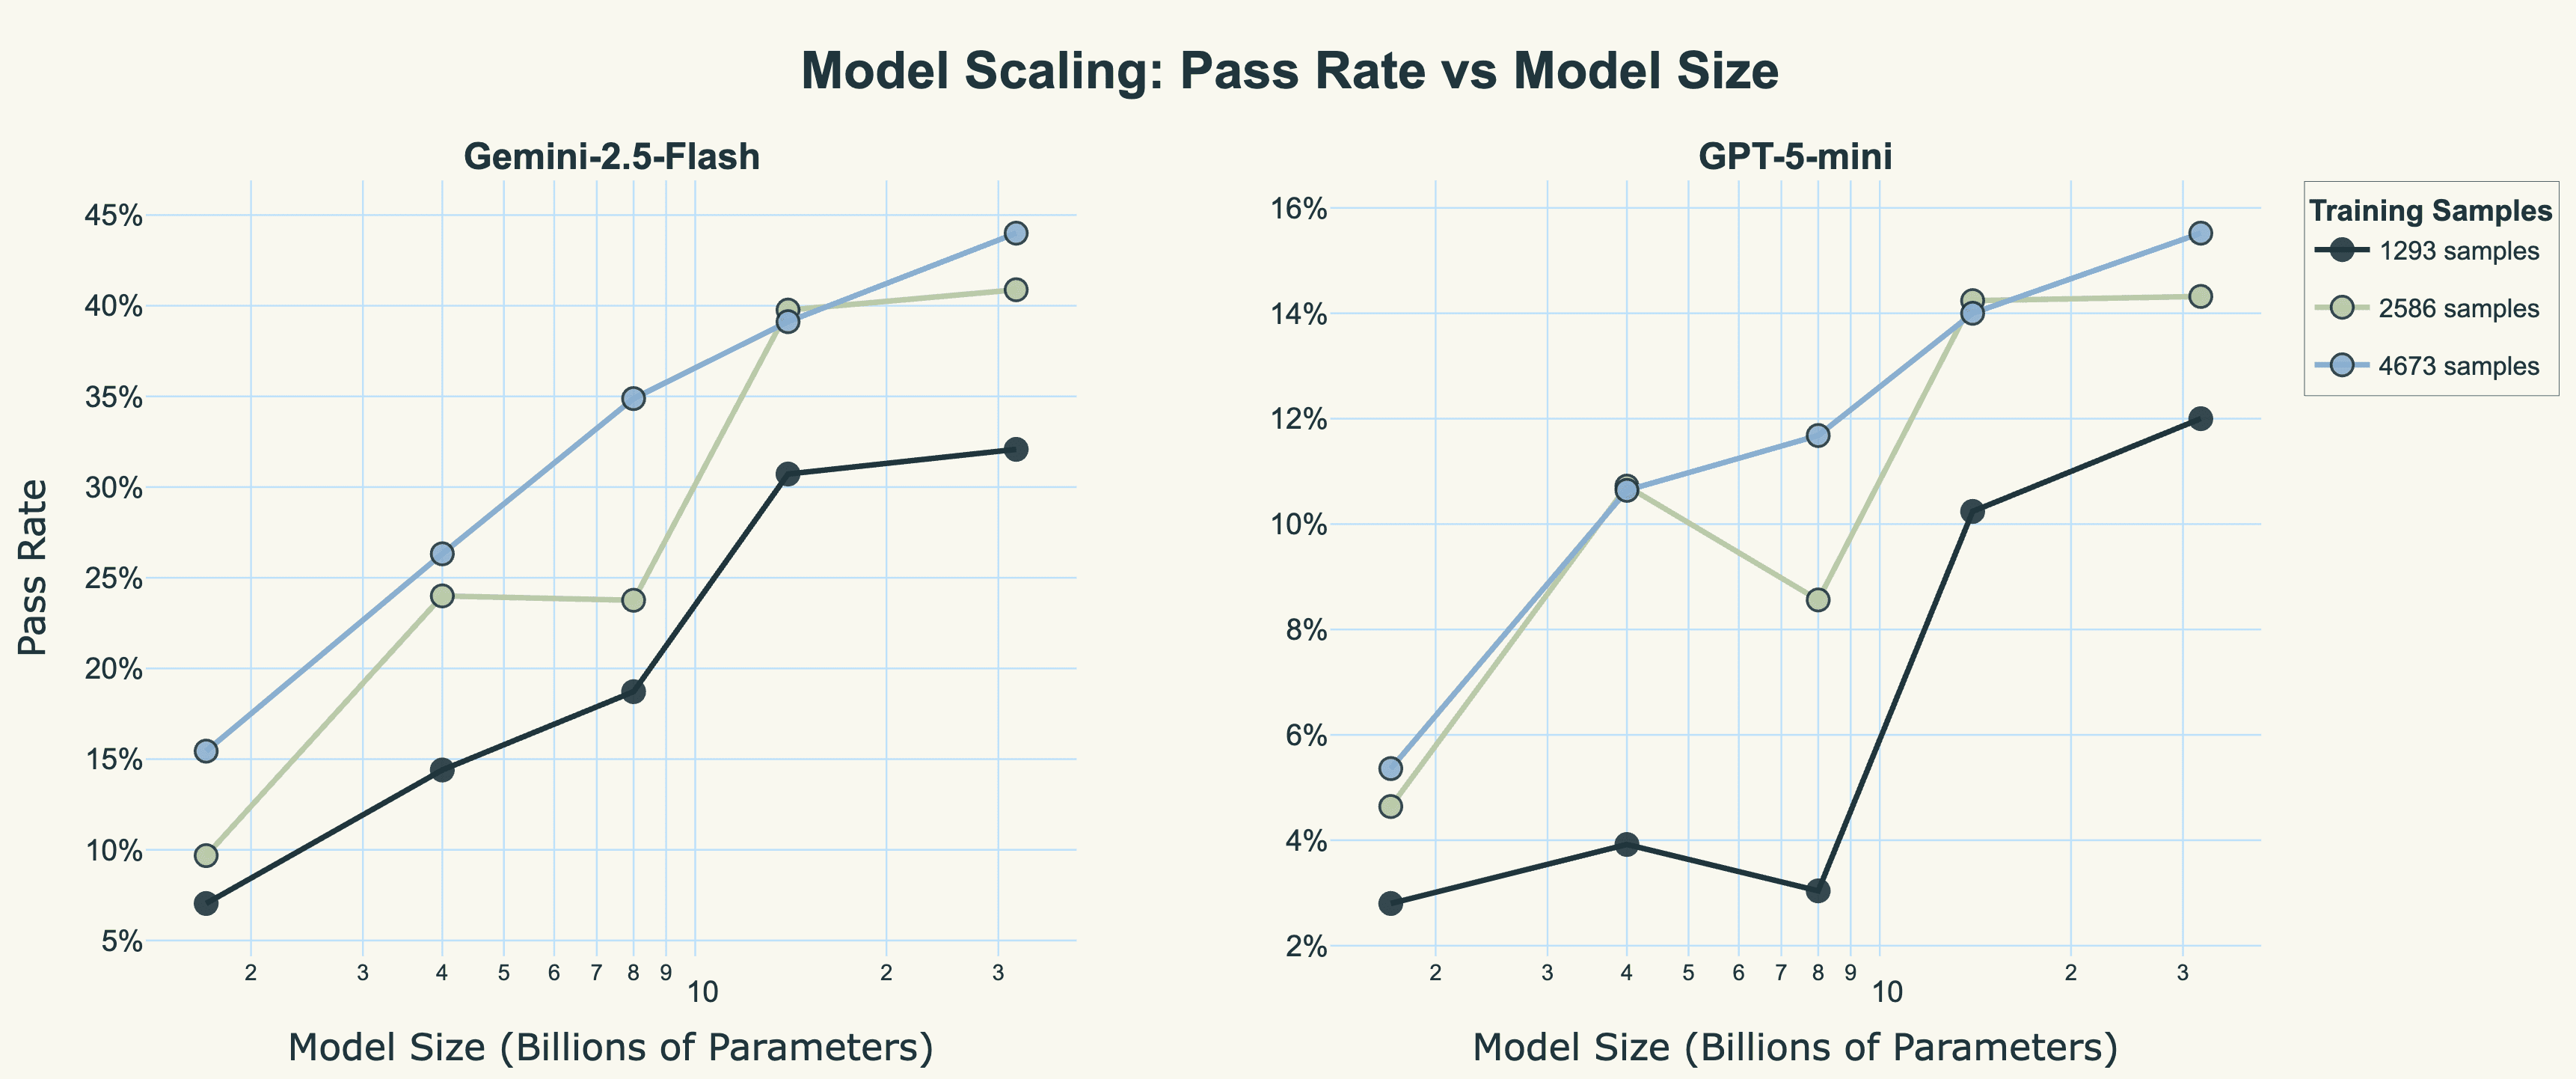
Figure 6: Model scaling curves for both LLM-as-judge evaluators. Despite GPT-5-mini being significantly more stringent than Gemini-2.5-Flash (2.8× lower pass rates on average), both evaluators show identical scaling behaviour: pass rates increase log-linearly with model size.
Both evaluators reveal the same fundamental scaling law: pass rates increase with model size but with diminishing returns, particularly beyond 14B parameters. The 32B model achieves 44% with Gemini and 15.5% with GPT-5-mini at full data; a 2.8x calibration gap in absolute terms, yet both show nearly identical relative scaling curves.
Conclusion and future work
While this exploration uses relatively modest scale, the patterns hold remarkably well in production. We've validated these same relationships with up to a million training examples and 235B parameter models across multiple customer tasks. The loss-performance correlation remains strong across different domains, from medical scribing to legal document analysis to insurance workflows.
There's one critical caveat: these results depend entirely on having high-quality LLM-as-judge evaluators. Bad judges produce noisy, inconsistent signals that break the clean relationship with training loss. We've invested heavily in solving this problem (see our thoughts on eval design here), developing an internal system that iteratively refines evaluation prompts to align with each customer's domain experts. Without this calibration ie if you just naively implement LLM judges, you'll get evaluators that are inconsistent, high-variance, and non-transitive, destroying the predictive power of loss.
Looking ahead, we're pursuing several key questions:
Where's the ceiling? Can we saturate a fine-tuned model to match the performance of the data it was trained on? If we train on GPT-5's outputs where GPT-5 scores 85% on our evals, at what data scale (if ever) does our fine-tuned model hit that same 85%?
RL vs iterative SFT efficiency: How do reinforcement learning and our iterative supervised fine-tuning (essentially smart rejection sampling) compare for reaching specific performance thresholds? Which gets to the asymptote faster?
Reverse validation: Can training loss help us evaluate the quality of our LLM judges themselves? If a judge's scores don't correlate with loss, is that judge actually measuring something meaningful?
The beauty of having loss as a reliable proxy is that it transforms how we approach these questions. Instead of running expensive evaluations on every configuration, we can use loss to map the optimisation landscape, then strategically evaluate only the most informative points. This makes evaluation surgical rather than eliminating it completely. We know exactly where to look, when to look, and what we're looking for.
Appendix
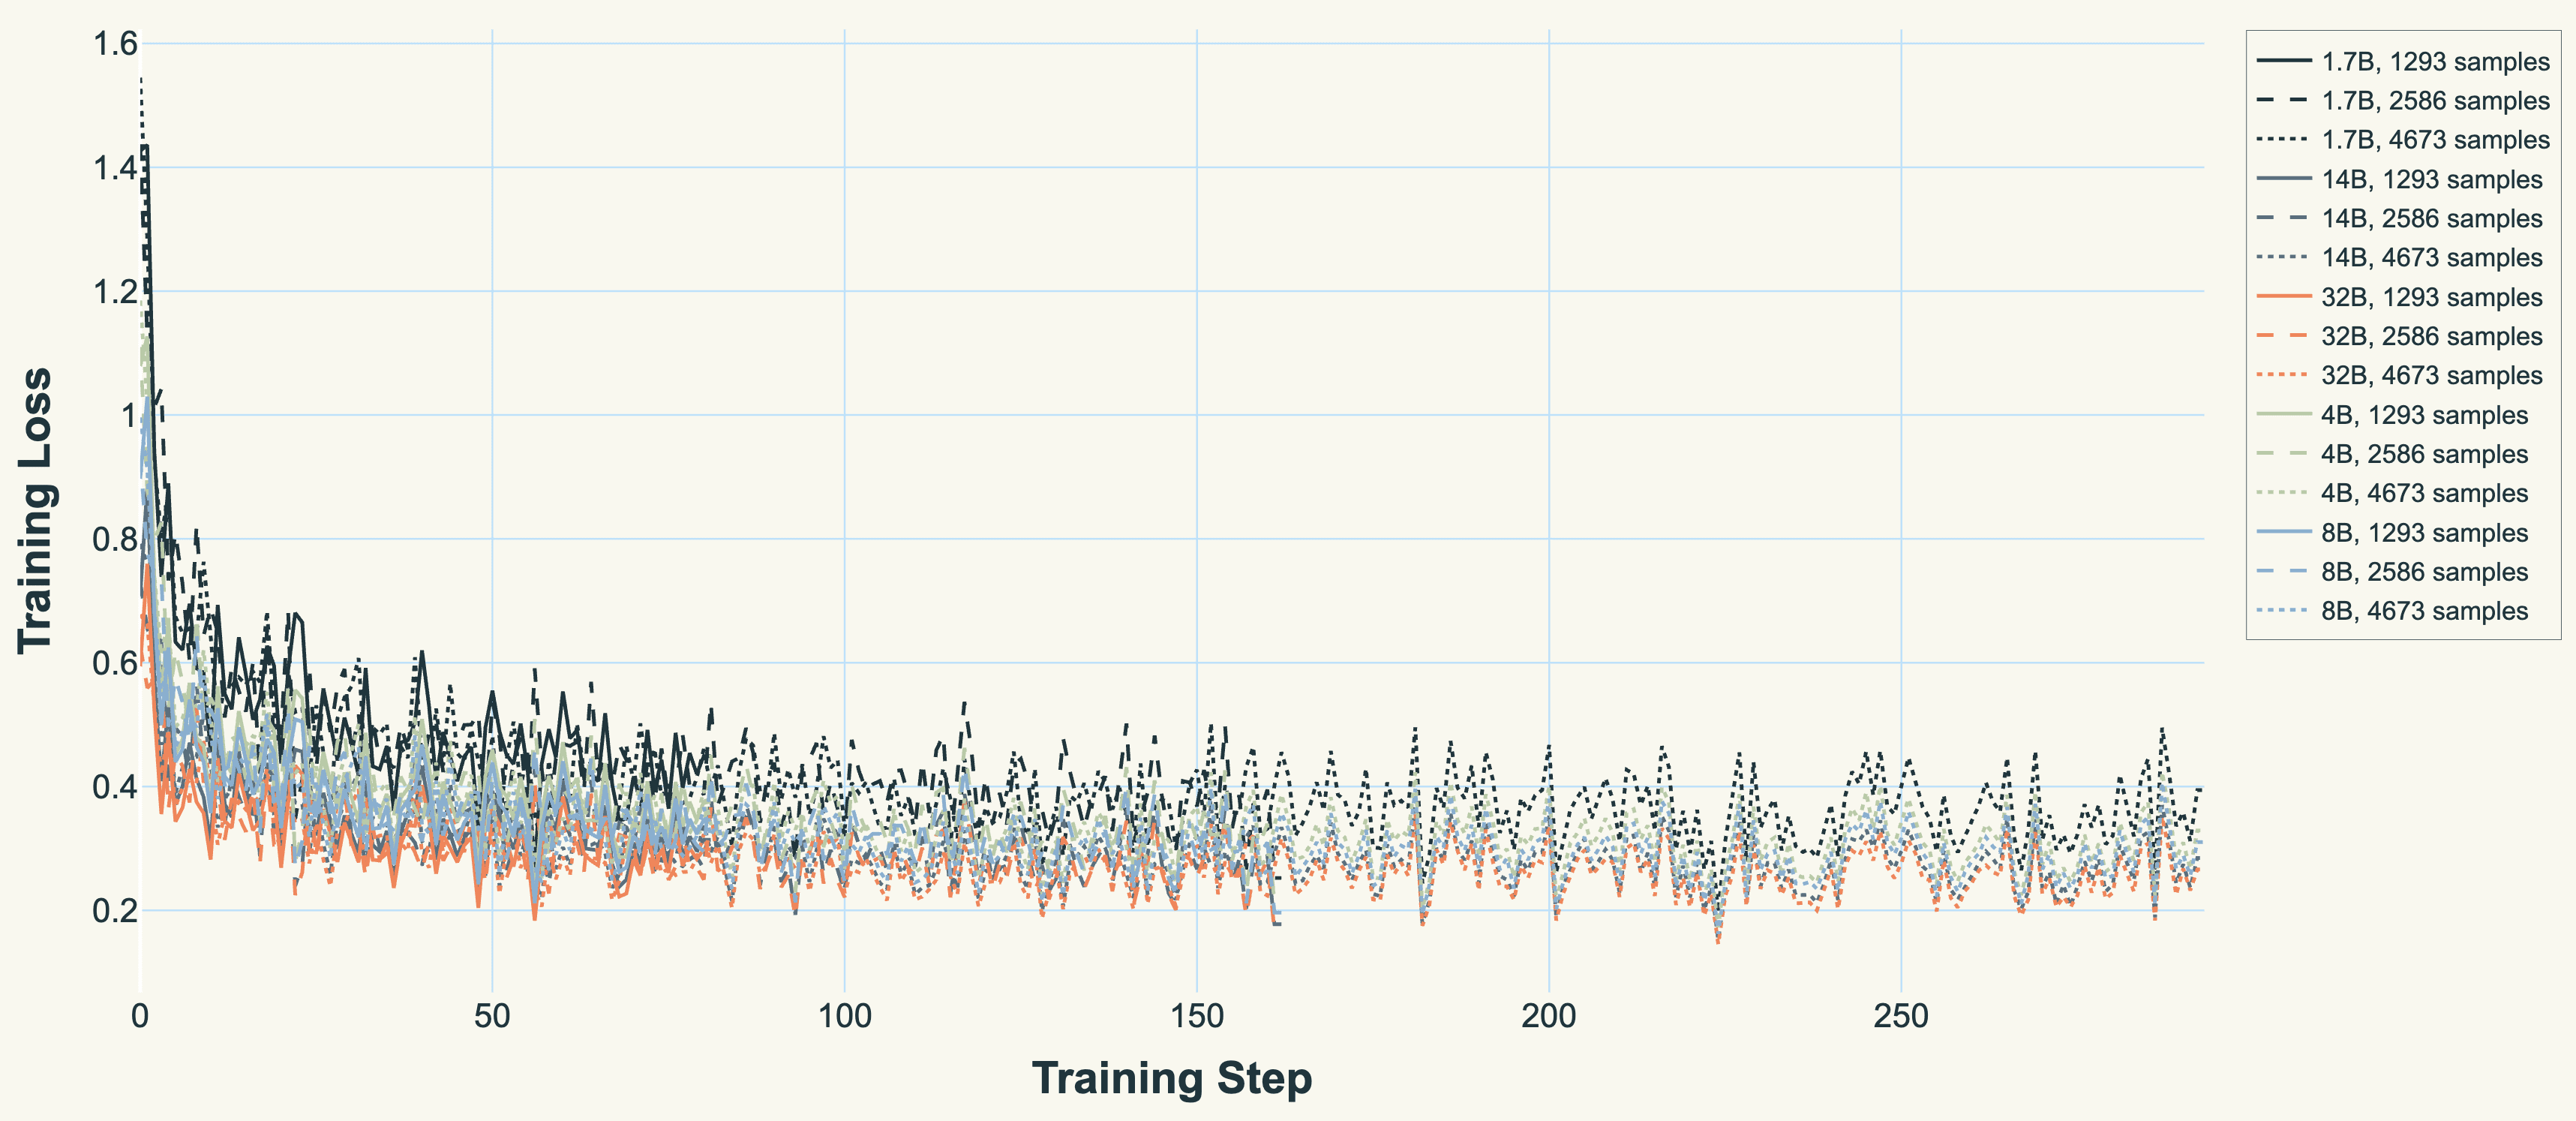
We include the loss curves for the sake of completeness.